Introducing audioFlux: a deep learning tool for audio feature extraction
![]()
Introduce
audioFlux is a library implemented in C and Python, which provides systematic, comprehensive and multi-dimensional feature extraction and combination in the audio field. In combination with various deep learning network models, it carries out business research and development in the audio field. Next, it briefly describes its relevant functions from six aspects: time-frequency transform, reassign spectrogram, cepstrum coefficient, deconvolution, spectral features, and music information retrieval.
Time-Frequency Transform
audioFlux in the field of time-frequency analysis, the following general transform algorithms (supporting all subsequent frequency scale types) are included:
BFT — Based Fourier Transform. The equivalent short-time Fourier transform (STFT) is generally based on this to realize the well-known mel spectrum. The Fourier transform with overlapping translation and window in the time domain is generally 1/4 of the length of the overlapping transform. The Gaussian window is also called Gabor transform. The length of the window function can be adjusted to facilitate the simulation of time-frequency analysis characteristics. In addition to providing standard mel/bar/erb and other spectra, the BFT algorithm also supports the complex spectrum of mel scale types, It also supports the rearrangement of mel equiscale spectrum.
NSGT — Non-Stationary Gabor Transform. Similar to STFT (short time Fourier transform) with Gaussian window, the difference is that the window function length and t establish a non-stationary relationship. Relative to STFT, it can achieve better analysis of non-stationary states in steady-state signals. The better onset endpoint detection effect is often based on such spectrum calculation, and can be used as an efficient way to achieve CQT. In this algorithm, the octave frequency scale type of NSGT transform is the efficient implementation of CQT.
CWT — Continuous Wavelet Transform. Multi-resolution time-frequency analysis: mathematically, the base of Fourier transform is infinite sin/cos function, while the base of wavelet transform is finite and very small wave function, The general expression of wave function is 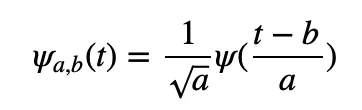 among them, a determines the scaling scale of frequency domain, b time translation scale, and establishes adaptive time-frequency analysis. Compared with the fixed time-frequency resolution of STFT, it has the characteristics of high frequency resolution in low frequency band and high time resolution in high frequency band, which is very suitable for non-stationary signal analysis, and supports the commonly used Morse, Morlet, Bump, Pual, Meyer and other wave functions.
PWT — Pseudo Wavelet Transform. Based on the similar effect of wavelet transform realized by Fourier transform, the efficient algorithm of CWT calculates filterBank and does dot operation for frequency domain wavelet function and frequency domain data. If the wavelet function is regarded as a special window function, it can produce CWT-like effect, namely pseudo-wavelet transform. If the window function establishes parameters of frequency band (not yet implemented in the library), it can be equivalent to wavelet transform.
The above conversion function supports all the following frequency scale types:
- Linear — Standard linear frequency band spectrum, half of the result of short-time Fourier transform is linear scale spectrum, and the scale is sampling rate/sampling sample, which is the minimum frequency resolution.
- Linsapce — The spectrum of the user-defined frequency band can be larger than the linear frequency band, which is equivalent to the time domain downsampling.
- Mel — Mel scale spectrogram, one of the most commonly used types of spectrogram in audio, is based on the characteristics of low frequency sensitivity and high frequency insensitivity of human hearing, and the log-like compressed linear scale.
- Bark — Bark scale spectrum diagram is more suitable for human hearing than Mel scale.
- ERB — Equivalent rectangular bandwidth scale spectrum, which is more consistent with human hearing than Barker scale.
- Octave — Octave scale spectrum.
- Log — Logarithmic scale spectrum.
The following is a simple comparison diagram of different frequency scales under BFT transform.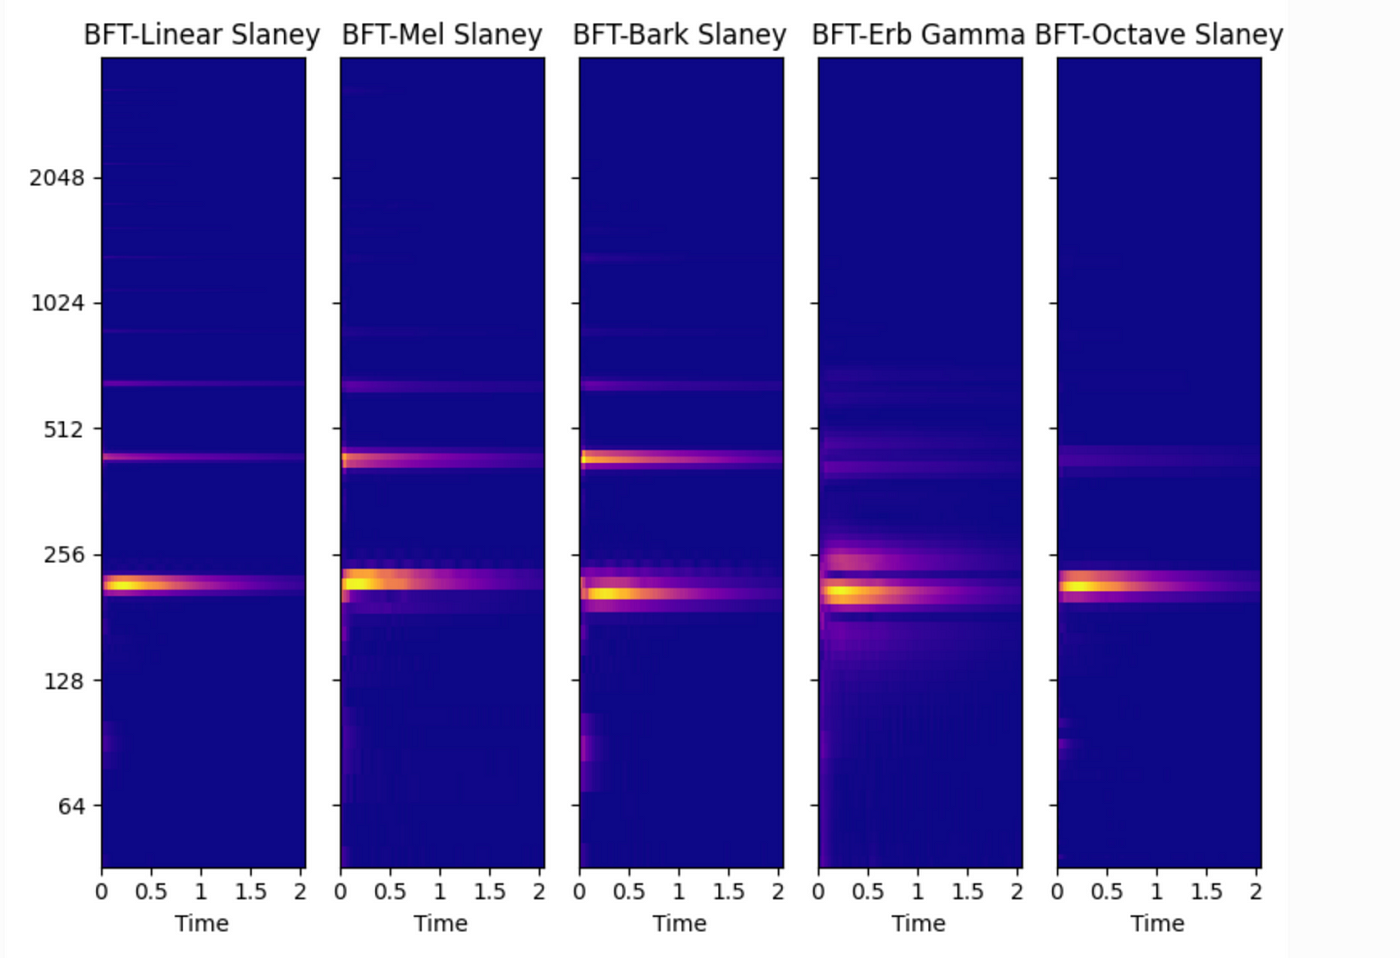
The following is a simple comparison diagram of different CWT wave functions.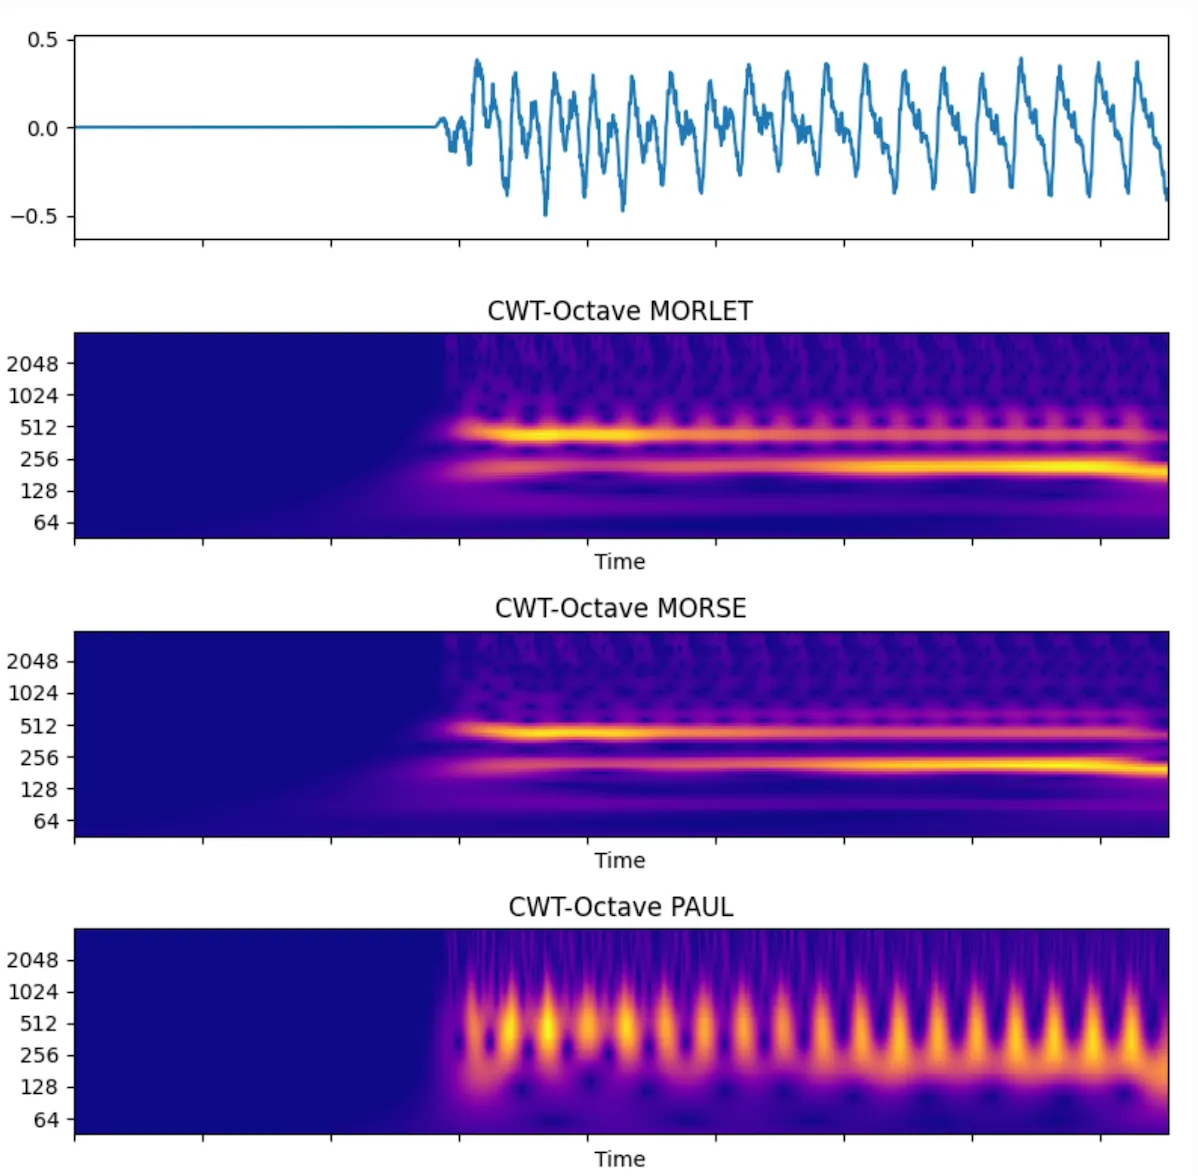
The following algorithms can be used as independent transform (multiple frequency scale types are not supported):
- CQT — Constant Q transform, which is a transform with constant frequency band ratio, is often used in music. Chroma features are often calculated based on this to analyze harmony.
- VQT — Variable Q transform.
- ST — S transform/Stockwell transform, similar to wavelet transform, is an extreme special case of wavelet transform thought, which can be used to detect and analyze some extreme abrupt signals, such as earthquakes, tsunamis, etc. Compared with NSGT, it also adds Gaussian windows, but establishes a scaling relationship between frequency and time.
- FST — Fast S transform, discrete base 2 implementation of S transform.
- DWT — Discrete wavelet transform, compared with CWT, frequency based on 2 transform.
- WPT — Wavelet packet transform, also known as wavelet packet decomposition, can perform detailed and approximate decomposition of signals. It is a way of signal separation and synthesis, and can be used for noise reduction, modal structure analysis and other businesses.
- SWT — Stationary wavelet transform, similar to wavelet packet transform, the decomposed signal is the same length as the original signal.
The following is a simple comparison of different scales under CQT and NSGT transform.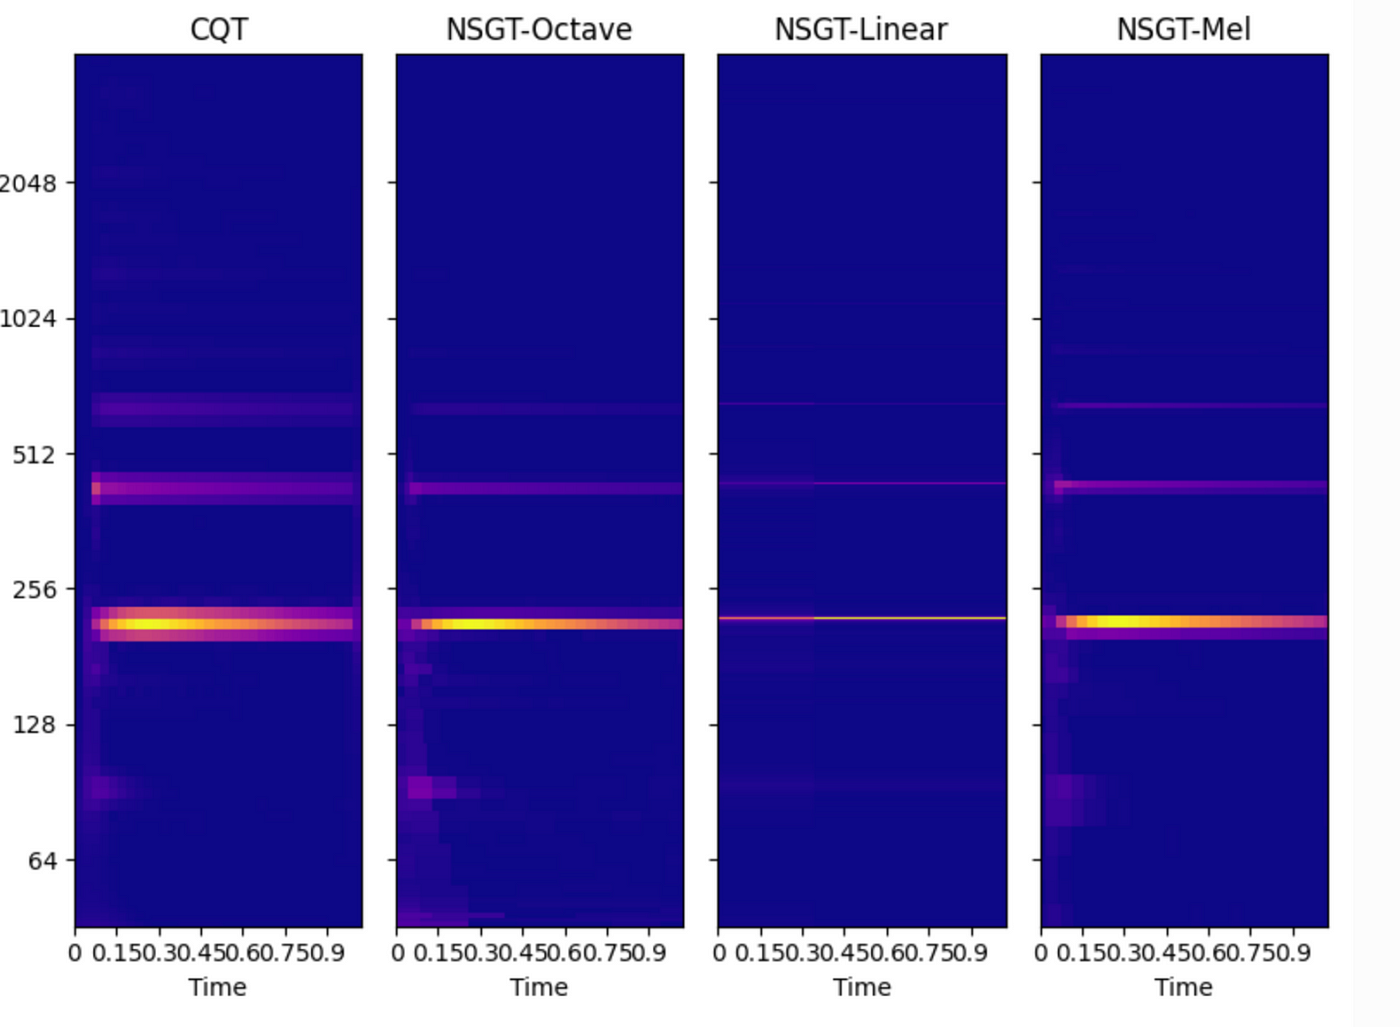
NSGT-Octave is clearer and more focused than CQT
Chroma is a higher-level feature based on spectrum, belonging to the category of musical scale system. The scale for non-musical tones is worse than that for musical tones. At present, it supports the spectrum types of Chroma features:
- CQT
- BFT-linear
- BFT-octave
Here is a simple comparison of Chroma.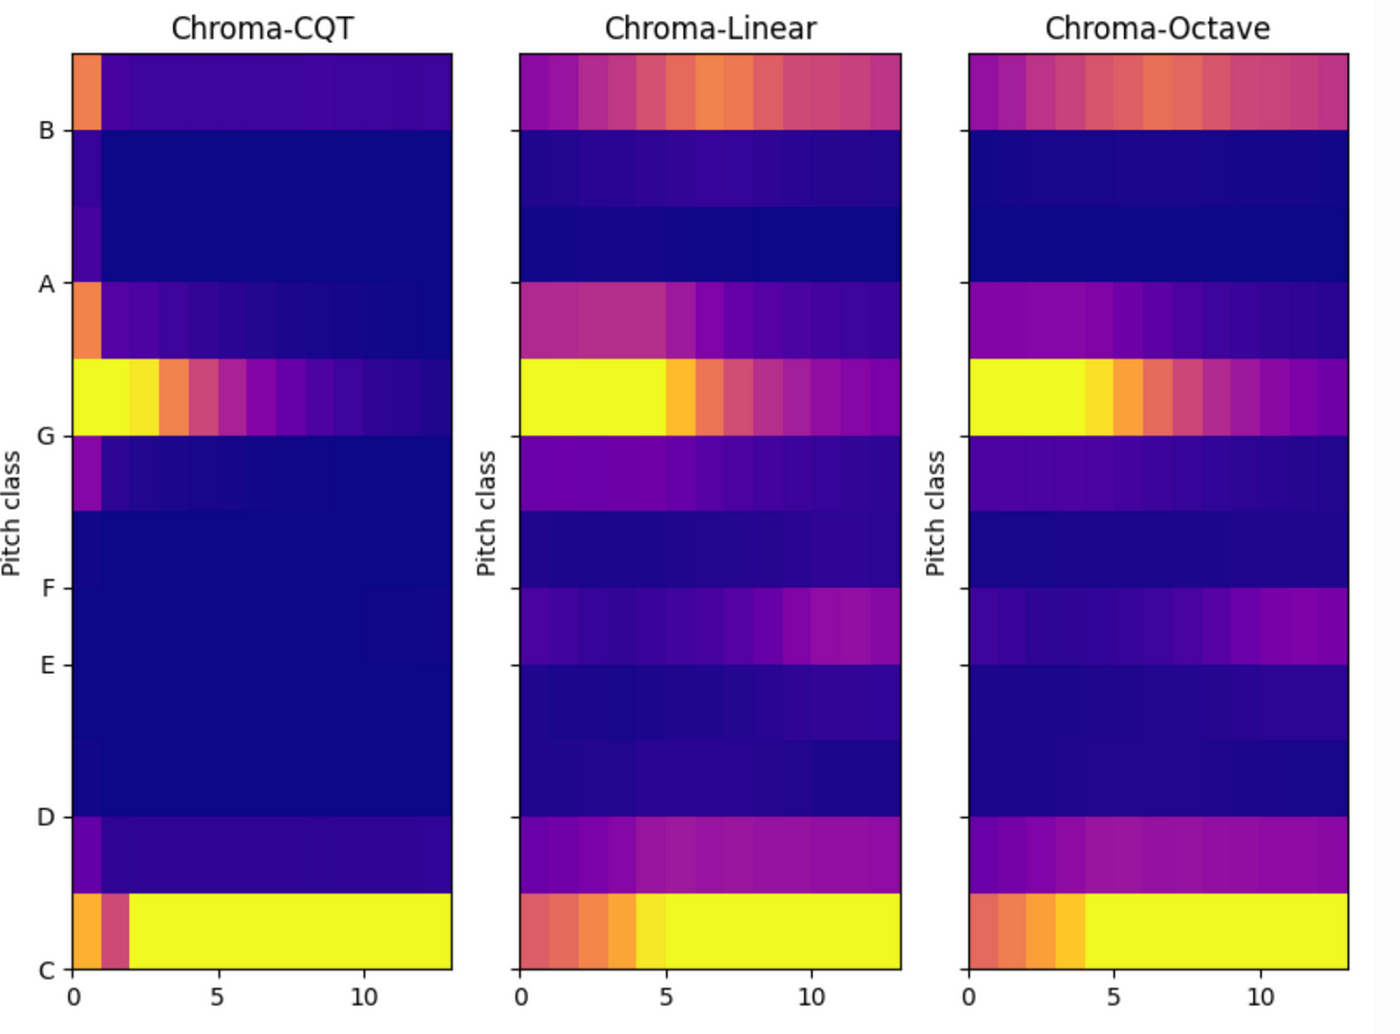
The spectrum with different frequency scales has their own application value. For some business situations, these spectrum maps with different scales can be combined to form a large feature set to participate in network training.
The spectrum diagram is called amplitude spectrum, power spectrum, logarithmic spectrum/dB spectrum according to the type of value abs, square, log and other nonlinear operations. The logarithmic spectrum is generally used more in deep learning.
Reassign Spectrogram
The synchrosqueezing or reassignment is a technique for sharpening a time-frequency representation, audioFlux includes the following algorithms:
- reassign — reassign transform for STFT.
- synsq — reassign data use CWT data.
- wsst — reassign transform for CWT.
Below is a spectrum diagram and the effect diagram after corresponding rearrangement.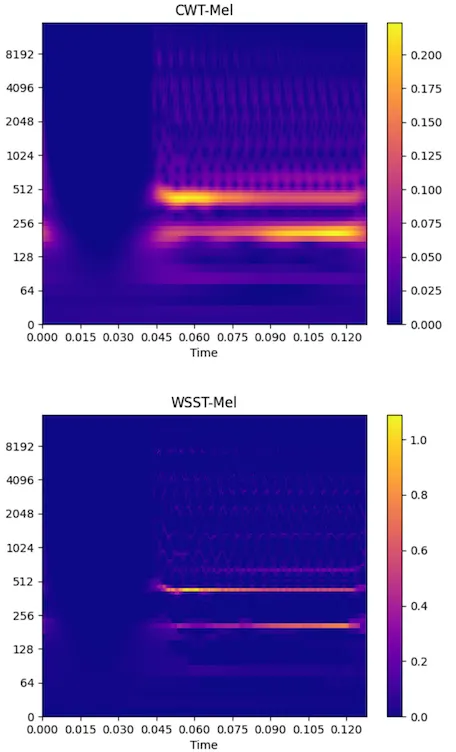
The effect after reassign is better than that before reassign.
Since the reassign effect is so good, can you rearrange it several times based on the last result? How does this work?
audioFluxreassign related algorithms provide multiple reassign mechanisms, and the specific effects can be compared by referring to the document.
Cepstrum Coefficient
Similar to mfcc (Mel frequency cepstrum coefficient) for mel spectrum, this feature service belongs to pitch removal, which is a feature reflecting the physical structure of pronunciation. It is typically used for voice recognition related services, and can be used for different instrument classification, structure refinement and other business model training.
The entire audioFlux in the project spectrum system, except mfcc and corresponding delta/deltaDelta, all types of spectrum cepstrum coefficients, namely xxcc, are supported:
- lfcc
- gtcc
- bfcc
- cqcc
- ……
The cepstrum coefficients of different spectrum types represent the pitch correlation of different spectrum types, and have their own application values. For example, the paper of gtcc reflects that the phoneme effect in speech recognition business is better than that of mfcc, and the classification and structure refinement business of cqcc for musical instruments are far better than that of mfcc.
The following is a comparison chart of different spectral cepstrum coefficients for guitar music and audio.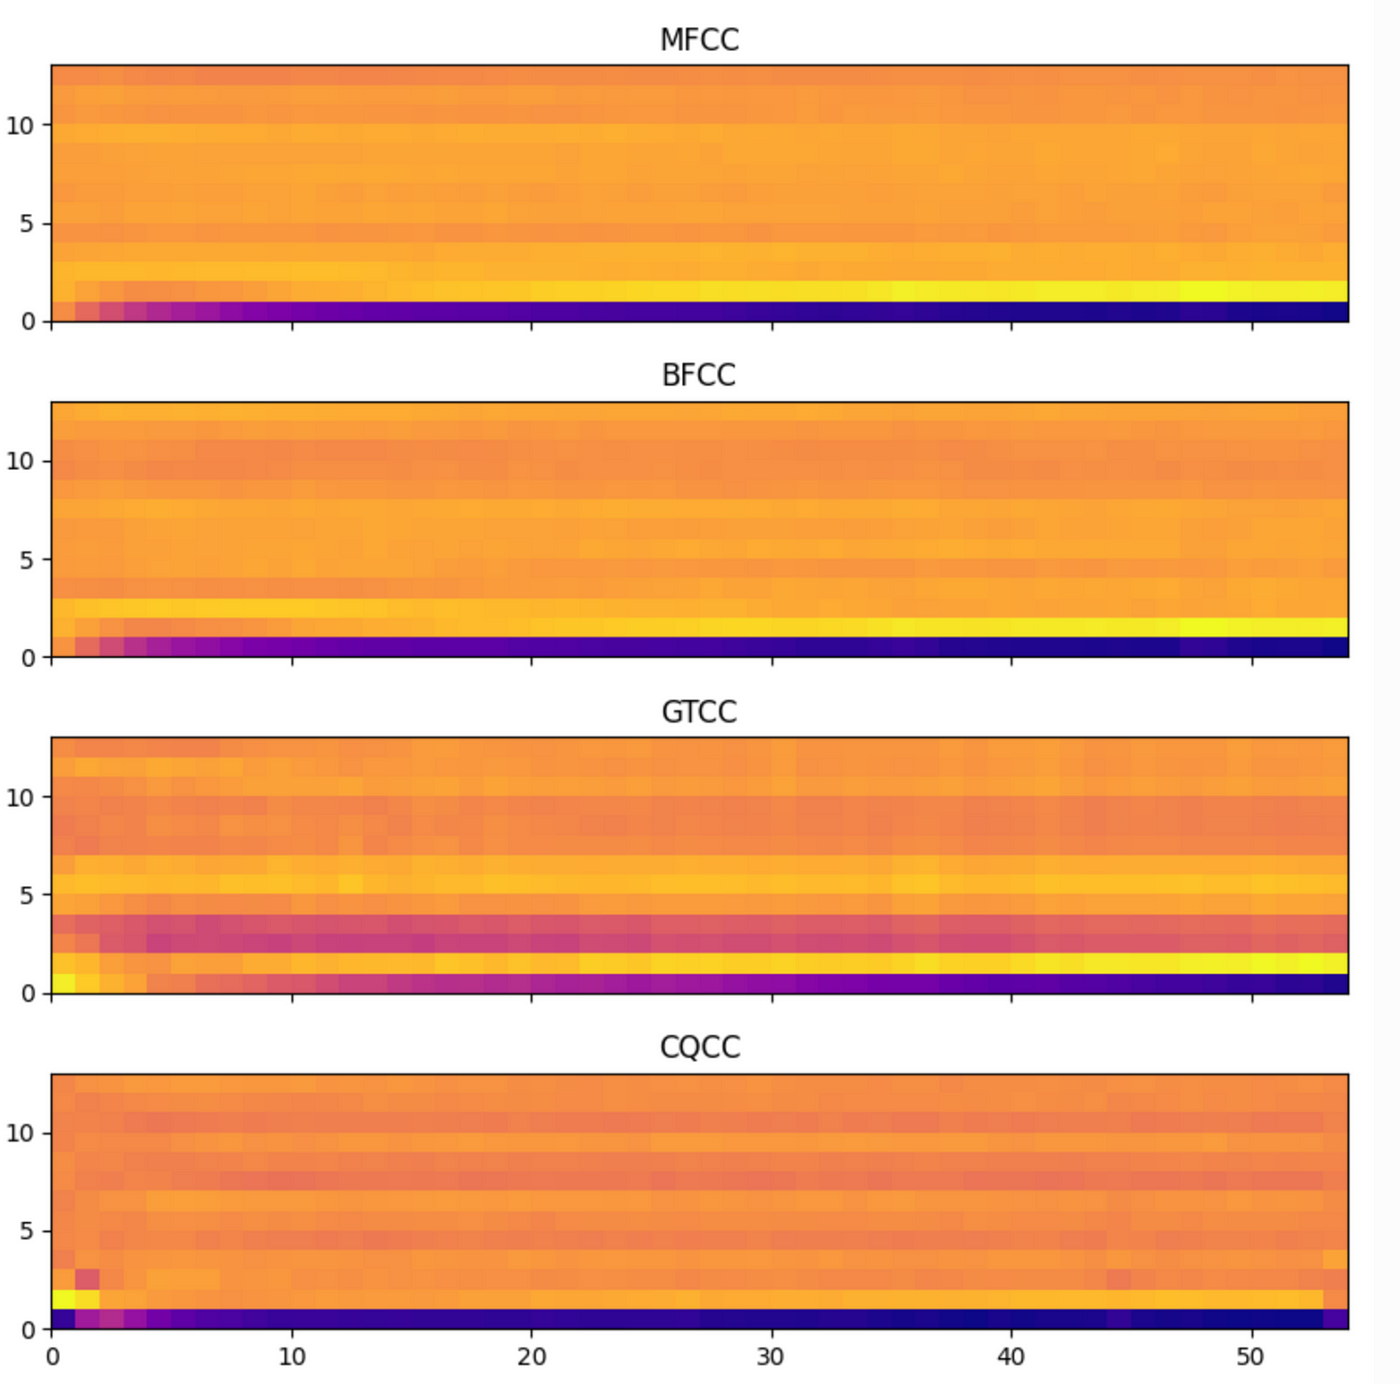
In the initial stage of guitar music, cqcc performs best, and in the subsequent stage of continuous stability, gtcc performs better.
Deconvolution
In mathematics, deconvolution is the inverse operation of convolution, which can be used as an algorithm for signal decomposition. For the spectrum, the two decomposed data can be represented as the formant spectrum and the pitch spectrum. Compared with mfcc, formant is a more general physical structural feature of pronunciation.
In audioFlux , the deconvolution operation of all types of spectrum is supported, and its value lies in that for pitch related services, the model inference can be more accurate after the formant interference is removed; For services with structure-related features, the pitch can be removed to avoid the interference of model training.
The following is the deconvolution effect of mel spectrum for guitar 880hz audio.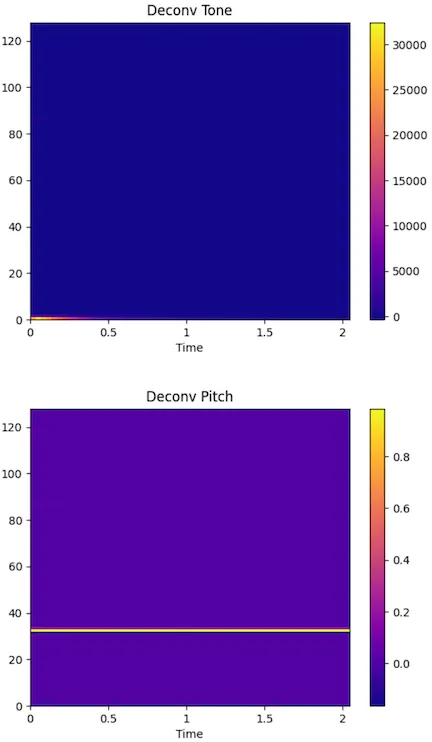
You can see the obvious separation effect between the formant part(timbre) and the pitch part of the guitar.
Spectral Feature
In audioFlux , there are dozens of spectral-related features, including those based on timbre correlation, statistical correlation, spectral flux correlation, singular value correlation, and so on.
For example:
- flatness
- skewness
- crest
- slop
- rolloff
- ……
- centroid
- spread
- kurtosis
- ……
- flux
- hfc
- mkl
- ……
- ……
For all spectral features provided by audioFlux , more specific functional descriptions, examples, formulas, etc., please refer to official documents.
The following is a comparison of some spectral feature.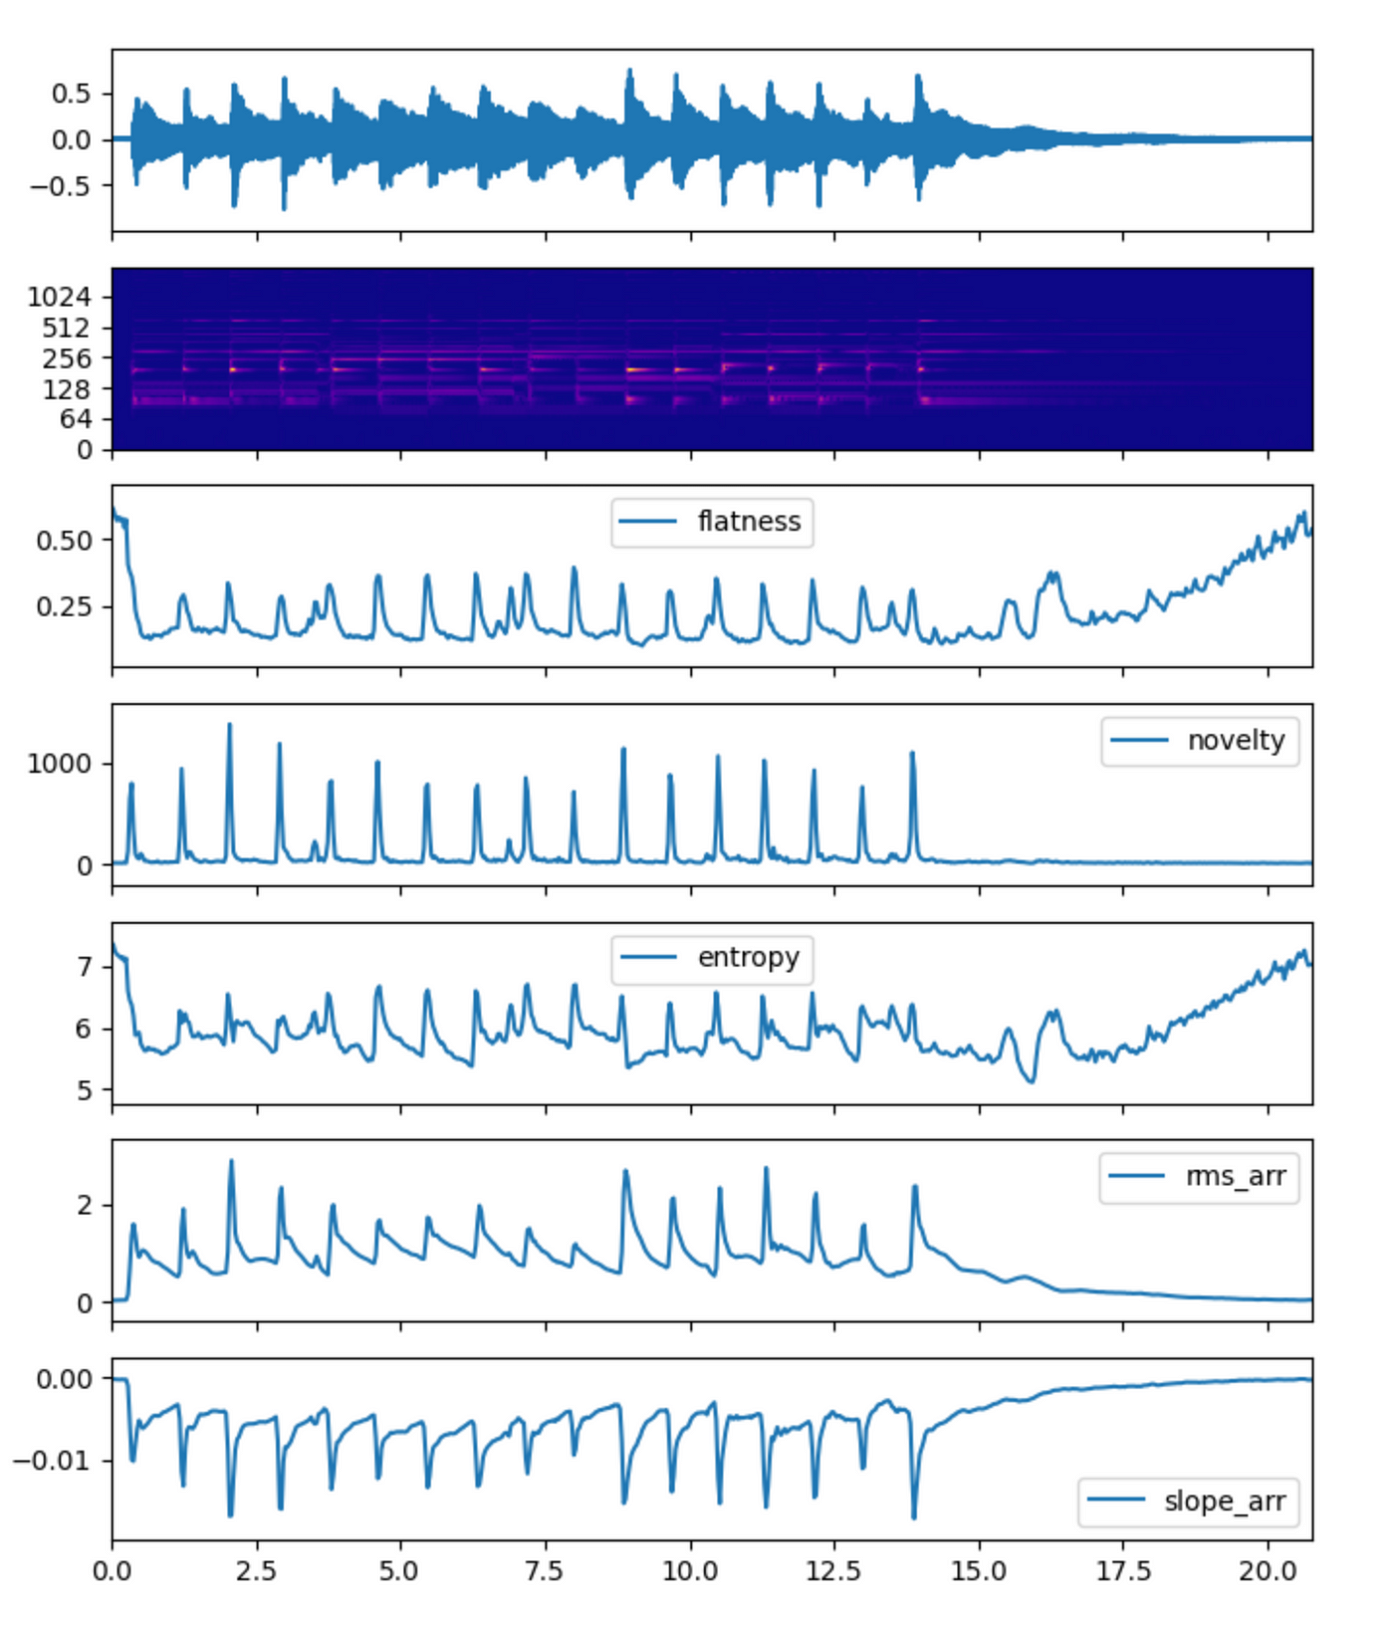
Music Information Retrieval
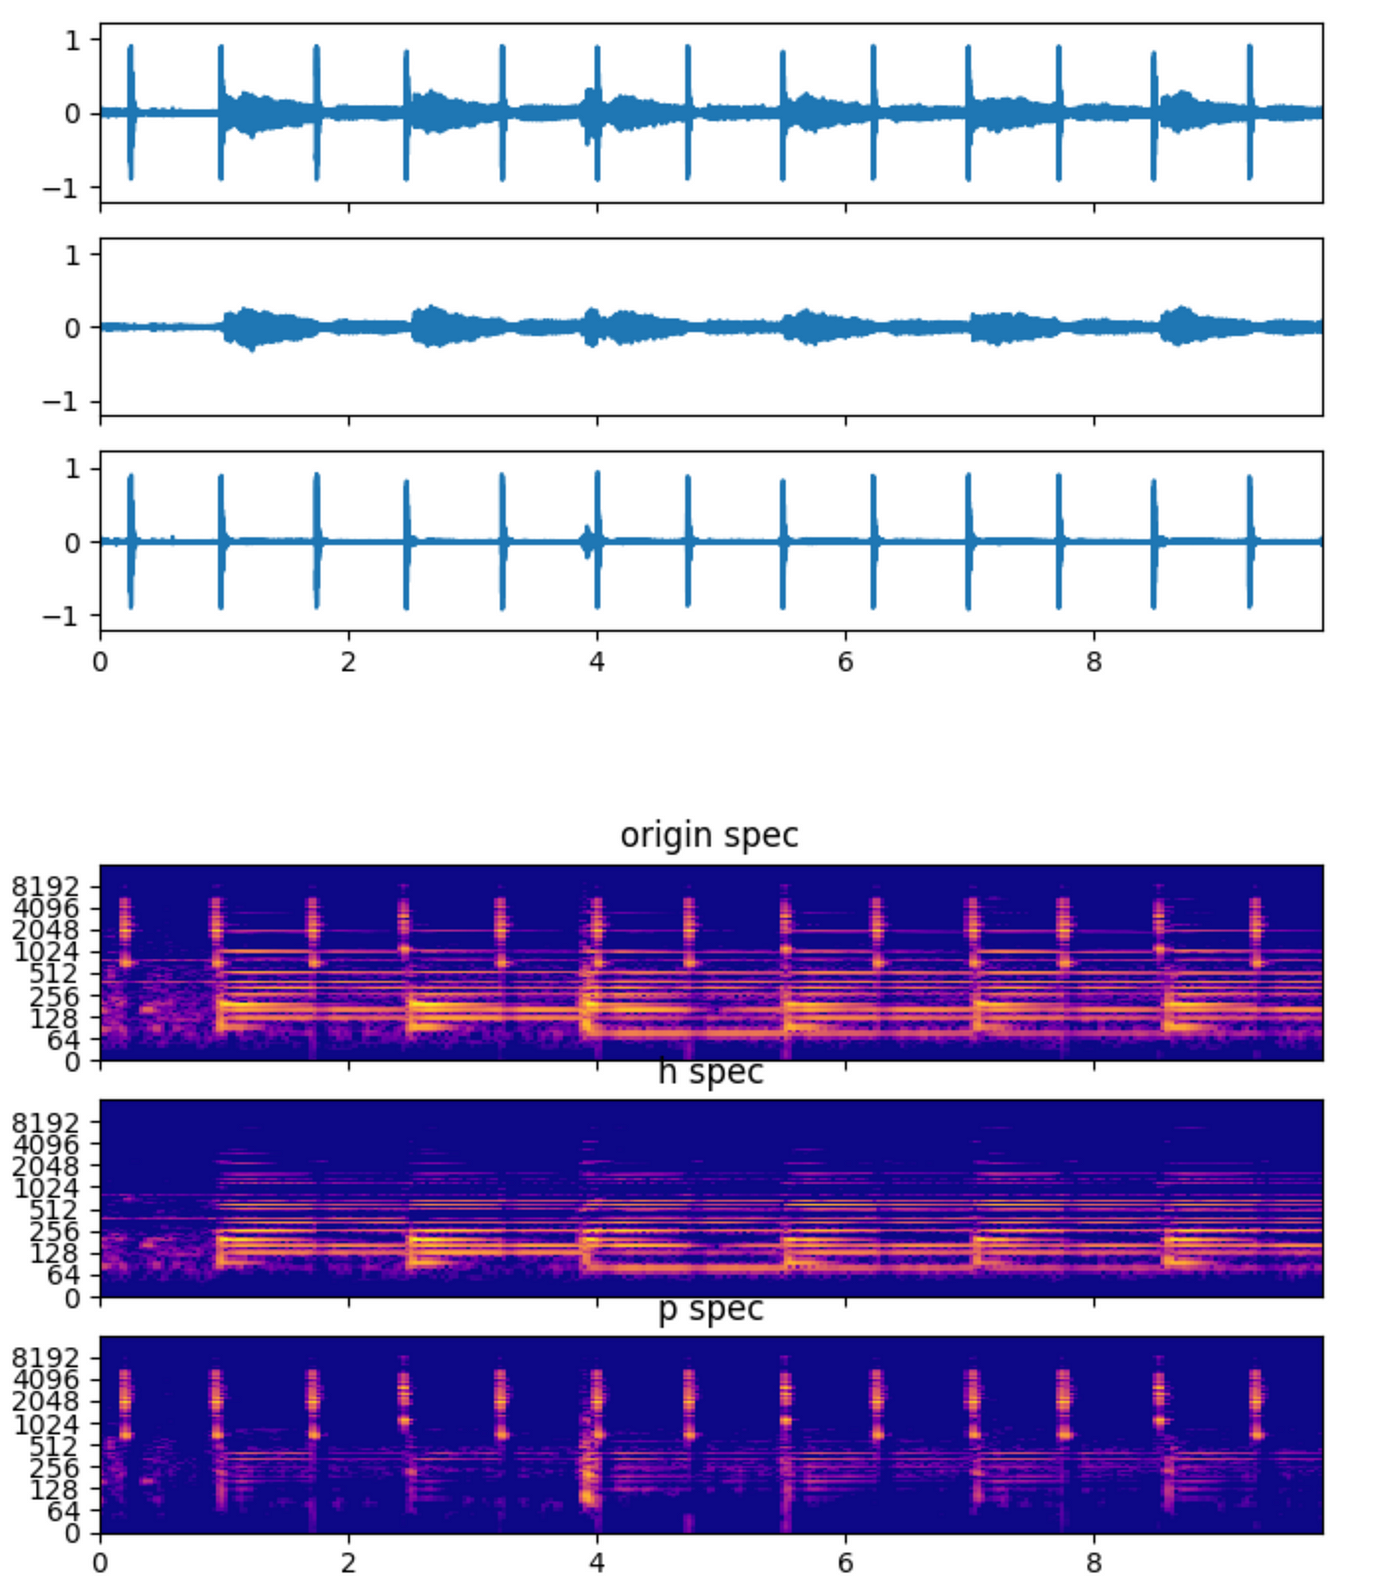
audioFlux provides mir-related fields such as pitch estimation, onset detection, hpss (harmonic percussion separation) and other related business algorithms.
The pitch estimation is based on YIN, STFT and other related algorithms. The following is the detection effect picture for a vocal practice pitch.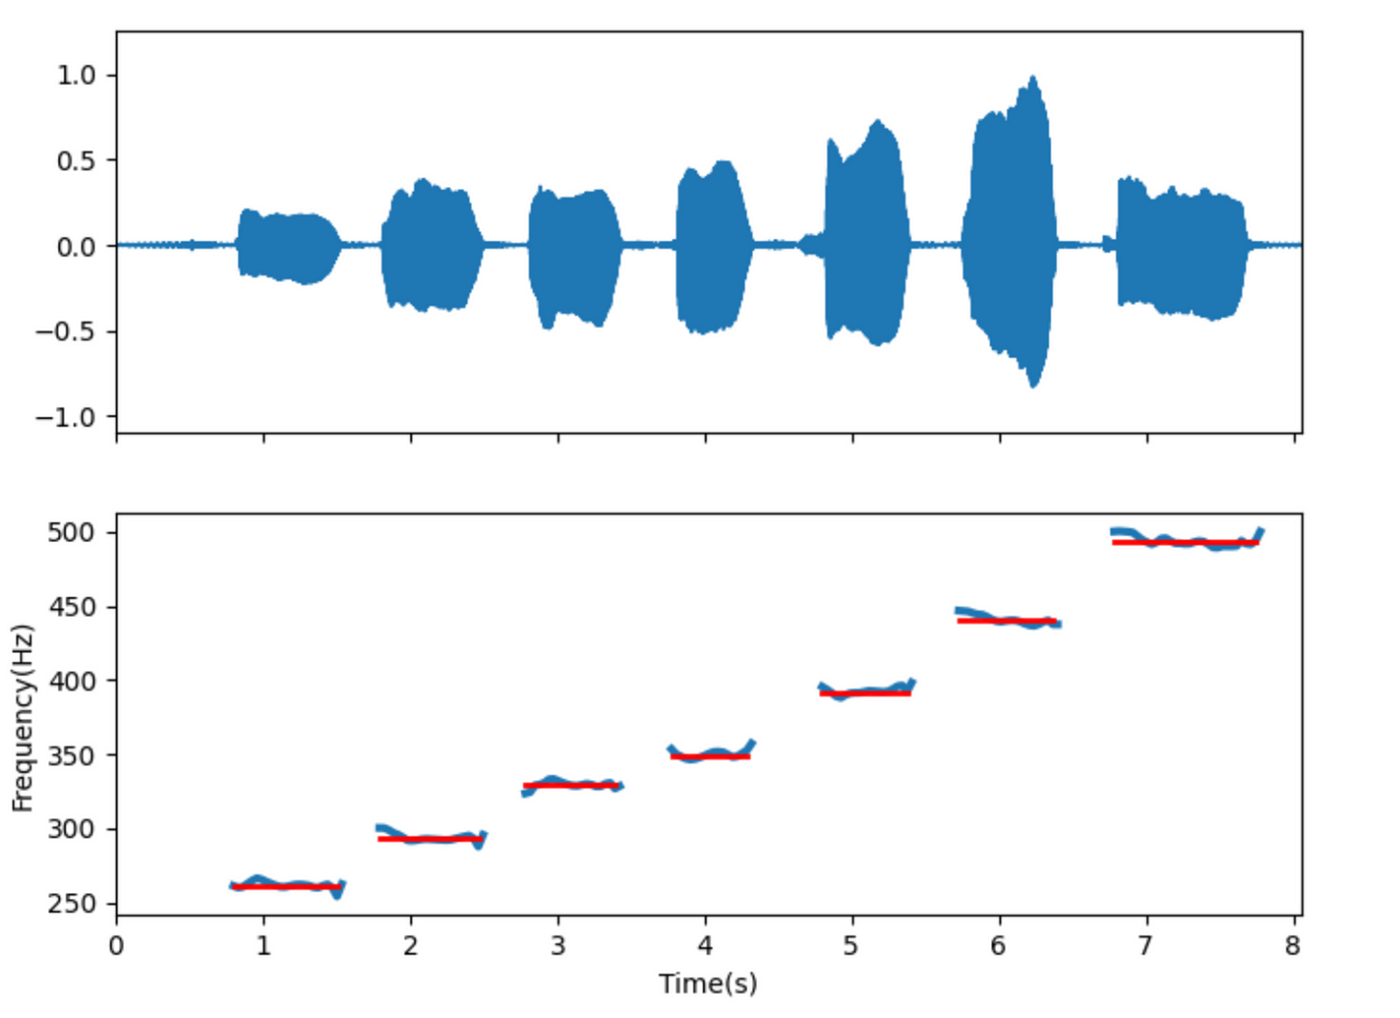
Red is the actual reference pitch, and blue is the estimated pitch.
The onset detection includes algorithms based on spectrum flux, novelty, and so on. The following is an endpoint detection rendering of a guitar sweep accompaniment.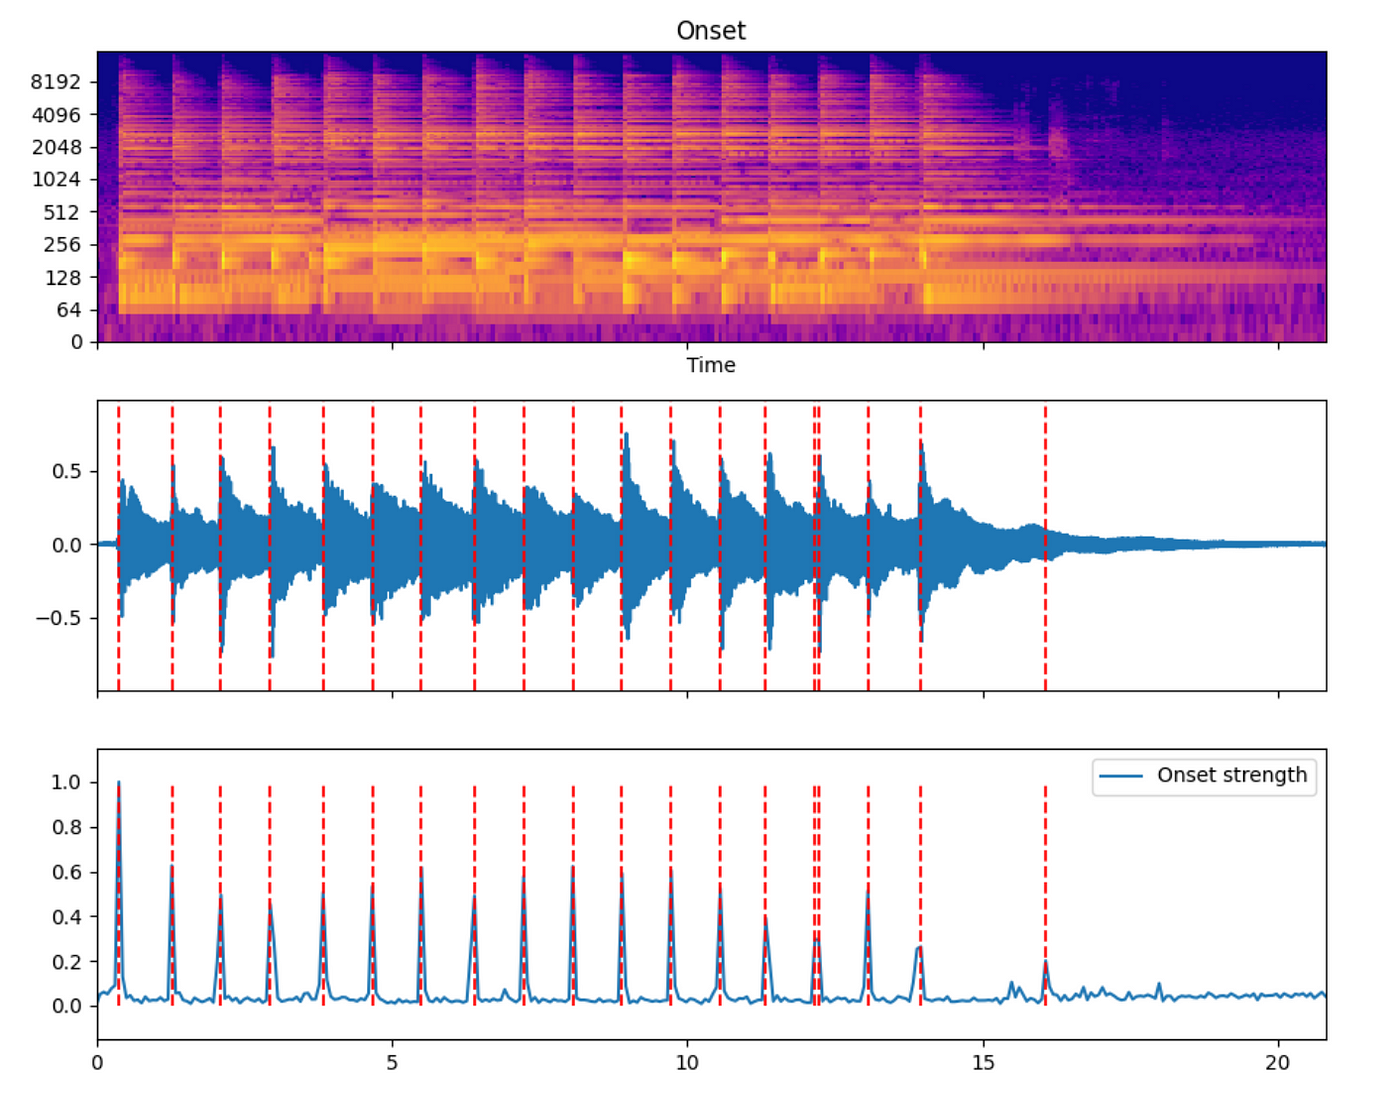
The red dotted line in the middle time domain image is superimposed by the endpoint detection position.
HPSS includes median filtering, non-negative matrix decomposition (NMF) and other algorithms. The following is a separation effect that includes guitar playing and metronome audio. The upper part of the time domain effect, and the lower part corresponds to the frequency domain effect.